Print

Student Handout - Worksheet: Informing with Infographics

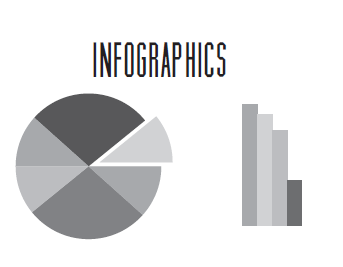
What are Infographics? image.png

Infographics or information graphics present information by taking key words, concepts, and illustrations to create a visual information resource. Infographics can be found on nearly any topic. Key concepts of infographics:
   • Ideas are clarified visually
   • Graphs, tables and charts may be conbined into one image


Lesson - Informing with Infographics

Students practice media literacy by creating infographics based on a selected e-Safety topic. They select an infographic tool; integrate multiple sources of information; evaluate the credibility and accuracy of each source, and translate quantitative data or technical information into visual form.

Student Handout - Worksheet: Informing with Infographics

Students practice media literacy by creating infographics based on a selected e-Safety topic. They select an infographic tool; integrate multiple sources of information; evaluate the credibility and accuracy of each source, and translate quantitative data or technical information into visual form.

Print

Reference Page - COPPA: Protecting a Child's Right to Privacy

Description

COPPA LAWS: Protecting a Child’s Right to Privacy

The Children’s Online Privacy Protection Act is a set of laws, passed in 1998, that protects the online privacy of persons under the age of 13. Online service providers must notify parents and gain consent before collecting personal identifying information (e.g. name, birthdate, age, gender) from children. Additional identifying information includes geolocation data (GPS); images, videos, and audio files of the child’s voice; Web browser cookies; a mobile device identifier (IMEI number); and the IP address of a computer or device.


Student Handout - Reference Page: COPPA

Student Handout - Reference Page: COPPA

Students recognize the importance of protecting online identity by engaging in class discussion. They list types of information that reveal personal identity; explain the purpose of protecting online identity; discuss the risks of revealing personally identifiable information; evaluate online profiles and behaviors for security and identity protection, and create a sketch of an online registration form and user profile for people under age 13.

Print

Teacher Reference Page - Quick Guide to Digital Programming: Delivery Methods & Instructions

Description

Note: Mozilla Firefox browser provided the optimum user experience during testing of Digital Instructional Content. Be sure to use the most updated version of the Web browser.

ISAFE Digital Learning Player: Whole-Class or Group Instruction


Lesson Plan - Social Media and Privacy with Dot & i (Digital)

Lesson Plan - Social Media and Privacy with Dot & i (Digital)

Dot helps i to understand responsible use of social media while attending a friend’s birthday party. Students learn how to respect others’ privacy and practice safe social networking through this interactive lesson featuring Dot & i. The lesson includes a teacher guide, printable activity pages, and interactive multimedia resources.

Print

Student Advisory Board Flyer


iDrive Youth Outreach & Empowerment Program

Prepare students to make a positive influence on the world through iDrive. iDrive is the Youth Outreach and Empowerment program of i-SAFE. Student-driven projects promote digital citizenship by empowering students to purposefully engage online and to deeply contribute to their communities.

iDrive Youth Outreach & Empowerment: Teacher Toolkit

Prepare students to make a positive influence on the world through iDrive. iDrive is the Youth Outreach and Empowerment program of i-SAFE. Student-driven projects promote digital citizenship by empowering students to purposefully engage online and to deeply contribute to their communities.

Teacher Reference Page 1 - About iDrive: Where the Rubber Meets the Road

Prepare students to make a positive influence on the world through iDrive. iDrive is the Youth Outreach and Empowerment program of i-SAFE. Student-driven projects promote digital citizenship by empowering students to purposefully engage online and to deeply contribute to their communities.

Teacher Reference Page 2 - Getting Started Guide for Educators

Prepare students to make a positive influence on the world through iDrive. iDrive is the Youth Outreach and Empowerment program of i-SAFE. Student-driven projects promote digital citizenship by empowering students to purposefully engage online and to deeply contribute to their communities.

Teacher Reference Page 3 - Let's Get Things Started: Teacher Edition

Prepare students to make a positive influence on the world through iDrive. iDrive is the Youth Outreach and Empowerment program of i-SAFE. Student-driven projects promote digital citizenship by empowering students to purposefully engage online and to deeply contribute to their communities.

Teacher Reference Page 4 - Pitch Your Initiative

Prepare students to make a positive influence on the world through iDrive. iDrive is the Youth Outreach and Empowerment program of i-SAFE. Student-driven projects promote digital citizenship by empowering students to purposefully engage online and to deeply contribute to their communities.

Student Advisory Board Flyer

Prepare students to make a positive influence on the world through iDrive. iDrive is the Youth Outreach and Empowerment program of i-SAFE. Student-driven projects promote digital citizenship by empowering students to purposefully engage online and to deeply contribute to their communities.

Print

Lesson - Statistics & Algebraic Equations with Internet Safety

Description

Lesson Overview

Students review information on predator awareness.


Unit - Integrated Math and Internet Safety

Unit - Integrated Math and Internet Safety

Students apply mathematical skills and concepts to collect, analyze and visually represent data sets related to e-Safety topics such as technology access, digital literacy, parental role in students' digital lives, digital security, cyber bullying, intellectual property, and personal safety. Resulting data sets may utilized as students prepare Empowerment projects and presentations that they will deliver on the school campus, in the local community, online and to the iDrive Student Advisory Board.

Lesson - Statistics & Algebraic Equations with Internet Safety

Lesson - Statistics & Algebraic Equations with Internet Safety

Students review information on predator awareness. They apply algebraic terms and concepts to solve equations that relate to e-Safety themes.

Student Handout 15 - Reference Page: Statistics & Algebraic Equations

Student Handout 15 - Reference Page: Statistics & Algebraic Equations

Students review information on predator awareness. They apply algebraic terms and concepts to solve equations that relate to e-Safety themes.

Student Handout 16 - Reference Page: Word Problem Rules & Practice

Student Handout 16 - Reference Page: Word Problem Rules & Practice

Students review information on predator awareness. They apply algebraic terms and concepts to solve equations that relate to e-Safety themes.

Teacher Reference Page - Answer Key: Word Problem Practice

Teacher Reference Page - Answer Key: Word Problem Practice

Students review information on predator awareness. They apply algebraic terms and concepts to solve equations that relate to e-Safety themes.

Print

Lesson - Survey and Statistics with Internet Safety

Description


Unit - Integrated Math and Internet Safety

Unit - Integrated Math and Internet Safety

Students apply mathematical skills and concepts to collect, analyze and visually represent data sets related to e-Safety topics such as technology access, digital literacy, parental role in students' digital lives, digital security, cyber bullying, intellectual property, and personal safety. Resulting data sets may utilized as students prepare Empowerment projects and presentations that they will deliver on the school campus, in the local community, online and to the iDrive Student Advisory Board.

Lesson - Survey and Statistics with Internet Safety

Lesson - Survey and Statistics with Internet Safety

Students investigate patterns of association in bi-variated data. They graph and analyze responses to statistical questions related to online risks (specifically cyber bullying). They acquire and use key terms including mode, median, mean, outliers, and range.

Student Handout 8 - Reference Page: Statistical Analysis Definitions

Student Handout 8 - Reference Page: Statistical Analysis Definitions

Students apply mathematical skills and concepts to collect, analyze and visually represent data sets related to e-Safety topics such as technology access, digital literacy, parental role in students' digital lives, digital security, cyber bullying, intellectual property, and personal safety. Resulting data sets may utilized as students prepare Empowerment projects and presentations that they will deliver on the school campus, in the local community, online and to the iDrive Student Advisory Board.

Student Handout 9 - Reference Page: Statistical Analysis - Computer Basics

Student Handout 9 - Reference Page: Statistical Analysis - Computer Basics

Students apply mathematical skills and concepts to collect, analyze and visually represent data sets related to e-Safety topics such as technology access, digital literacy, parental role in students' digital lives, digital security, cyber bullying, intellectual property, and personal safety. Resulting data sets may utilized as students prepare Empowerment projects and presentations that they will deliver on the school campus, in the local community, online and to the iDrive Student Advisory Board.

Student Handout 10 - Reference Page: Statistical Analysis - Parents & the Internet

Student Handout 10 - Reference Page: Statistical Analysis - Parents & the Internet

Students apply mathematical skills and concepts to collect, analyze and visually represent data sets related to e-Safety topics such as technology access, digital literacy, parental role in students' digital lives, digital security, cyber bullying, intellectual property, and personal safety. Resulting data sets may utilized as students prepare Empowerment projects and presentations that they will deliver on the school campus, in the local community, online and to the iDrive Student Advisory Board.

Student Handout 11 - Reference Page: Statistical Analysis - Malicious Code

Student Handout 11 - Reference Page: Statistical Analysis - Malicious Code

Students apply mathematical skills and concepts to collect, analyze and visually represent data sets related to e-Safety topics such as technology access, digital literacy, parental role in students' digital lives, digital security, cyber bullying, intellectual property, and personal safety. Resulting data sets may utilized as students prepare Empowerment projects and presentations that they will deliver on the school campus, in the local community, online and to the iDrive Student Advisory Board.

Student Handout 12 - Reference Page: Statistical Analysis - Cyber Bullying

Student Handout 12 - Reference Page: Statistical Analysis - Cyber Bullying

Students apply mathematical skills and concepts to collect, analyze and visually represent data sets related to e-Safety topics such as technology access, digital literacy, parental role in students' digital lives, digital security, cyber bullying, intellectual property, and personal safety. Resulting data sets may utilized as students prepare Empowerment projects and presentations that they will deliver on the school campus, in the local community, online and to the iDrive Student Advisory Board.

Student Handout 13 - Reference Page: Statistical Analysis - Intellectual Property

Student Handout 13 - Reference Page: Statistical Analysis - Intellectual Property

Students apply mathematical skills and concepts to collect, analyze and visually represent data sets related to e-Safety topics such as technology access, digital literacy, parental role in students' digital lives, digital security, cyber bullying, intellectual property, and personal safety. Resulting data sets may utilized as students prepare Empowerment projects and presentations that they will deliver on the school campus, in the local community, online and to the iDrive Student Advisory Board.

Student Handout 14 - Reference Page: Statistical Analysis - Personal Safety

Student Handout 14 - Reference Page: Statistical Analysis - Personal Safety
Students apply mathematical skills and concepts to collect, analyze and visually represent data sets related to e-Safety topics such as technology access, digital literacy, parental role in students' digital lives, digital security, cyber bullying, intellectual property, and personal safety. Resulting data sets may utilized as students prepare Empowerment projects and presentations that they will deliver on the school campus, in the local community, online and to the iDrive Student Advisory Board.

Print

Lesson - More Graphing with Internet Safety

Description

Lesson Overview

Students practice graphic representation of statistics related to e-Safety.


Unit - Integrated Math and Internet Safety

Unit - Integrated Math and Internet Safety

Students apply mathematical skills and concepts to collect, analyze and visually represent data sets related to e-Safety topics such as technology access, digital literacy, parental role in students' digital lives, digital security, cyber bullying, intellectual property, and personal safety. Resulting data sets may utilized as students prepare Empowerment projects and presentations that they will deliver on the school campus, in the local community, online and to the iDrive Student Advisory Board.

Lesson - More Graphing with Internet Safety

Lesson - More Graphing with Internet Safety

Students practice graphic representation of statistics related to e-Safety. They collect responses to statistical questions from a sample of the student population. They use a linear model (line graph), bar graph, and circle graph (pie chart) to represent and interpret data.

Student Handout 1 - Reference Page: Types of Graphs

Student Handout 1 - Reference Page: Types of Graphs

Students practice graphic representation of statistics related to e-Safety. They collect responses to statistical questions from a sample of the student population. They use a linear model (line graph), bar graph, and circle graph (pie chart) to represent and interpret data.

Student Handout 2 - Reference Page: Statistical Data - Computer Basics

Student Handout 2 - Reference Page: Statistical Data - Computer Basics

Students practice graphic representation of statistics related to e-Safety. They collect responses to statistical questions from a sample of the student population. They use a linear model (line graph), bar graph, and circle graph (pie chart) to represent and interpret data.

Student Handout 3 - Reference Page: Statistical Data - Parents & the Internet

Student Handout 3 - Reference Page: Statistical Data - Parents & the Internet

Students practice graphic representation of statistics related to e-Safety. They collect responses to statistical questions from a sample of the student population. They use a linear model (line graph), bar graph, and circle graph (pie chart) to represent and interpret data.

Student Handout 4 - Reference Page: Statistical Data - Malicious Code

Student Handout 4 - Reference Page: Statistical Data - Malicious Code

Students practice graphic representation of statistics related to e-Safety. They collect responses to statistical questions from a sample of the student population. They use a linear model (line graph), bar graph, and circle graph (pie chart) to represent and interpret data.

Student Handout 5 - Reference Page: Statistical Data - Cyber Bullying

Student Handout 5 - Reference Page: Statistical Data - Cyber Bullying

Students practice graphic representation of statistics related to e-Safety. They collect responses to statistical questions from a sample of the student population. They use a linear model (line graph), bar graph, and circle graph (pie chart) to represent and interpret data.

Student Handout 6 - Reference Page: Statistical Data - Intellectual Property

Student Handout 6 - Reference Page: Statistical Data - Intellectual Property

Students practice graphic representation of statistics related to e-Safety. They collect responses to statistical questions from a sample of the student population. They use a linear model (line graph), bar graph, and circle graph (pie chart) to represent and interpret data.

Student Handout 7 - Reference Page: Statistical Data - Personal Safety

Student Handout 7 - Reference Page: Statistical Data - Personal Safety

Students practice graphic representation of statistics related to e-Safety. They collect responses to statistical questions from a sample of the student population. They use a linear model (line graph), bar graph, and circle graph (pie chart) to represent and interpret data.

Print

Lesson - Introduction to Graphing with Internet Safety

Description

Lesson Overview

Students understand that statistics can be used to gain information about a


Unit - Integrated Math and Internet Safety

Unit - Integrated Math and Internet Safety

Students apply mathematical skills and concepts to collect, analyze and visually represent data sets related to e-Safety topics such as technology access, digital literacy, parental role in students' digital lives, digital security, cyber bullying, intellectual property, and personal safety. Resulting data sets may utilized as students prepare Empowerment projects and presentations that they will deliver on the school campus, in the local community, online and to the iDrive Student Advisory Board.

Lesson - Introduction to Graphing with Internet Safety

Lesson - Introduction to Graphing with Internet Safety

Students understand that statistics can be used to gain information about a population. They gather responses to statistical questions and represent the data as a bar graph.

Student Handout - Reference Page: Graphing

Student Handout - Reference Page: Graphing

Students understand that statistics can be used to gain information about a population. They gather responses to statistical questions and represent the data as a bar graph.

Print

Unit - Integrated Math and Internet Safety

Description

Youth Empowerment: Leave Your Mark

iDrive is the Youth Outreach and Empowerment program of ISAFE.


Unit - Integrated Math and Internet Safety

Unit - Integrated Math and Internet Safety

Students apply mathematical skills and concepts to collect, analyze and visually represent data sets related to e-Safety topics such as technology access, digital literacy, parental role in students' digital lives, digital security, cyber bullying, intellectual property, and personal safety. Resulting data sets may utilized as students prepare Empowerment projects and presentations that they will deliver on the school campus, in the local community, online and to the iDrive Student Advisory Board.

Lesson - Introduction to Graphing with Internet Safety

Lesson - Introduction to Graphing with Internet Safety

Students understand that statistics can be used to gain information about a population. They gather responses to statistical questions and represent the data as a bar graph.

Lesson - More Graphing with Internet Safety

Lesson - More Graphing with Internet Safety

Students practice graphic representation of statistics related to e-Safety. They collect responses to statistical questions from a sample of the student population. They use a linear model (line graph), bar graph, and circle graph (pie chart) to represent and interpret data.

Lesson - Survey and Statistics with Internet Safety

Lesson - Survey and Statistics with Internet Safety

Students investigate patterns of association in bi-variated data. They graph and analyze responses to statistical questions related to online risks (specifically cyber bullying). They acquire and use key terms including mode, median, mean, outliers, and range.

Lesson - Statistics & Algebraic Equations with Internet Safety

Lesson - Statistics & Algebraic Equations with Internet Safety

Students review information on predator awareness. They apply algebraic terms and concepts to solve equations that relate to e-Safety themes.

Print

Lesson - Informing with Infographics

Description

Lesson Guide

Students will explore how infographics distill information visually and the role they ca


Lesson - Informing with Infographics

Lesson - Informing with Infographics

Students practice media literacy by creating infographics based on a selected e-Safety topic. They select an infographic tool; integrate multiple sources of information; evaluate the credibility and accuracy of each source, and translate quantitative data or technical information into visual form.

Student Handout - Worksheet: Informing with Infographics

Student Handout - Worksheet: Informing with Infographics

Students practice media literacy by creating infographics based on a selected e-Safety topic. They select an infographic tool; integrate multiple sources of information; evaluate the credibility and accuracy of each source, and translate quantitative data or technical information into visual form.

Subscribe to Math